This is an old revision of the document!
Table of Contents
Power consumption testing

The Plan
I want to measure the voltage over time as the device discharges so I can calculate how much power each component uses. I will run the following tests:
- JP1 open, disconnecting the LED and microcontroller,
- This should measure the self-discharge and leakage across the Zener D2.
- JP1 closed, running unoptimised naive code, blinking the message “ss s”
- This should set a baseline for comparing power saving improvements to code.
- JP1 closed, and power-optimised code blinking the message “ss s”.
- LED on 100%,
- LED off 100%,
- These two tests should isolate the power consumption of the microcontroller from the LED.
Then graph everything and crunch the numbers.
My 121GW multimeter can log measurements to an SD card. For each of these tests I will charge the supercaps to maximum and then let it discharge to 1.4v.
The Results
Raw numbers are available here.

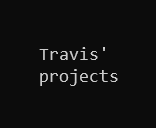
In this graph the red line shows the voltage over time of the capacitor when the microcontroller and LED are isolated. The blue line shows the voltage over time with the microcontroller and LED running the naive code.

This graph shows the difference between the two curves above - the voltage drop that can be attributed to the microcontroller+LED doing their job.