Table of Contents
Power consumption testing
The Plan
I want to measure the voltage over time as the device discharges so I can calculate how much power each component uses. I will run the following tests:
- JP1 open, disconnecting the LED and microcontroller from the supercaps,
- This should measure the self-discharge and leakage across the Zener D2.
- JP1 closed, running unoptimised naive code, blinking the message “ss s”
- This should set a baseline for comparing power saving improvements to code.
- JP1 closed, and power-optimised code blinking the message “ss s”.
- LED on 100%,
- LED off 100%,
- These two tests should isolate the power consumption of the microcontroller from the LED.
Then graph everything and crunch the numbers.
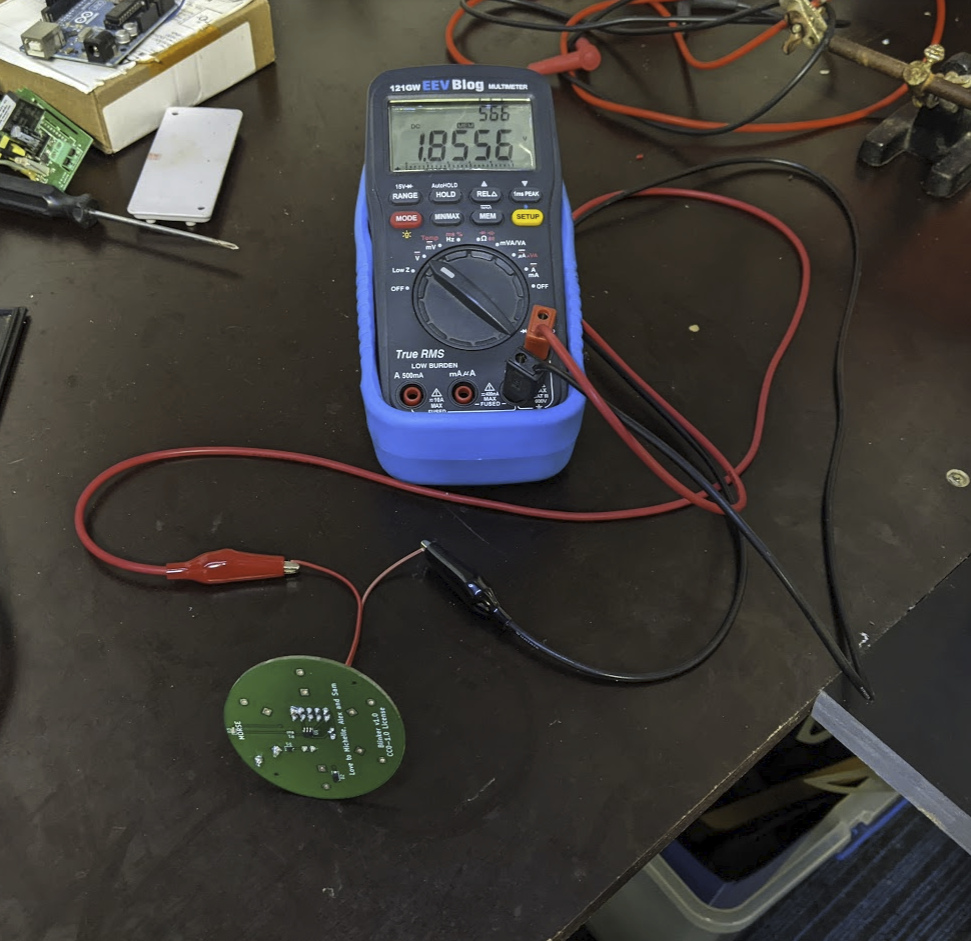
My 121GW multimeter can log measurements to an SD card. For each of these tests I will charge the supercaps to maximum and then let it discharge to 1.4v.
The Results
Unoptimised code vs passive losses
As of running these tests the blinker has only one 25 farad supercap installed. The final design allows for six 40 farad caps, so it currently has around 10% of the design energy capacity.
Raw multimeter logs are available here.
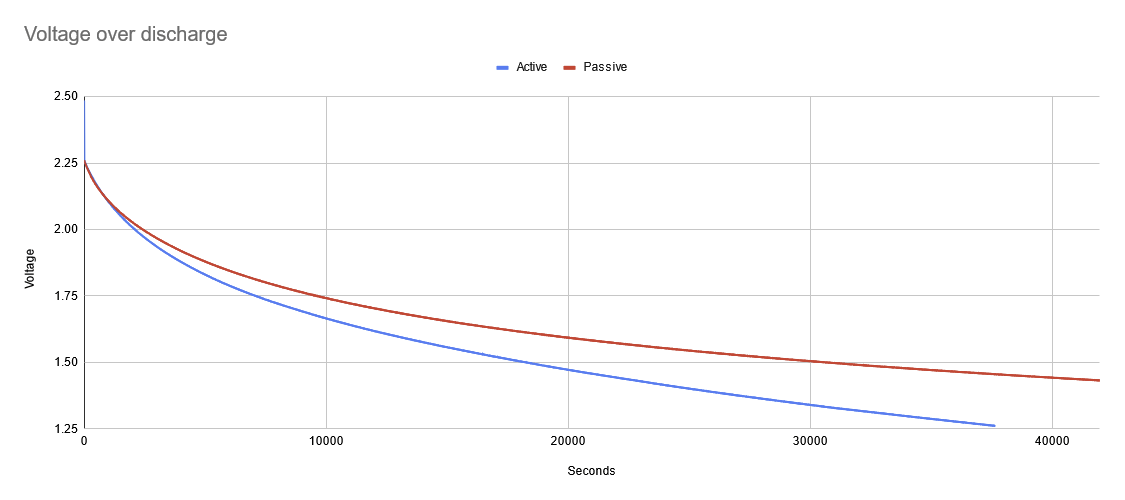
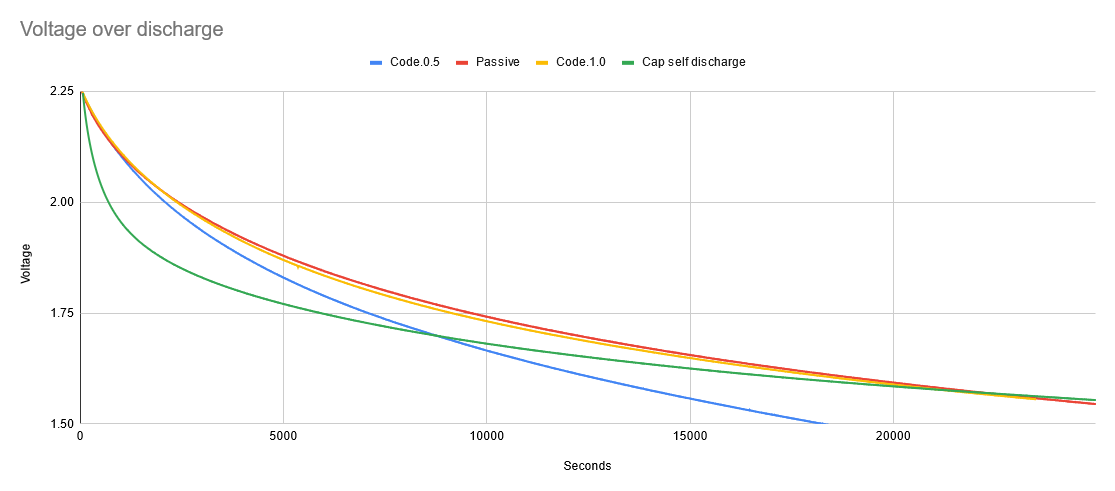
In this graph the red line shows the voltage over time of the capacitor when the microcontroller and LED are isolated. The blue line shows the voltage over time with the microcontroller and LED running the naive code.
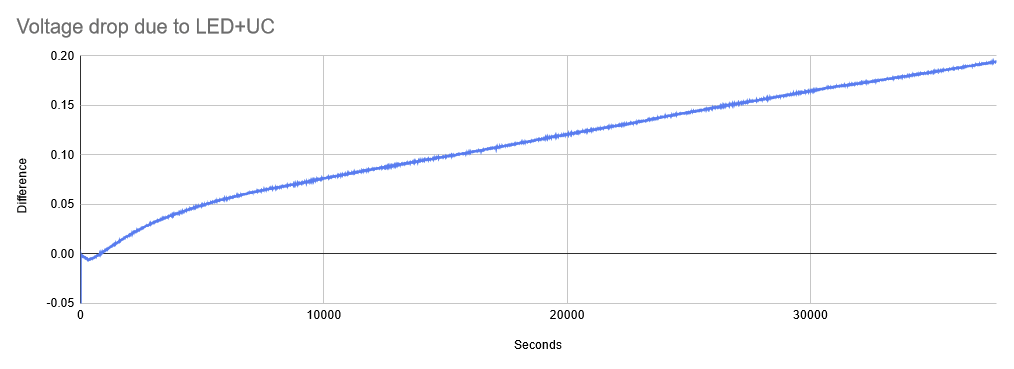
This graph shows the difference between the two curves above - the voltage drop that can be attributed to the microcontroller+LED doing their job. Somewhere between 1.5v and 1.4293v the LED became too dim to see in a dark room.
At T=20000s the voltages were 1.4723v and 1.5933v from a starting voltage of 2.258v. This gives us a voltage drop of 0.7857v and 0.6647v. 0.121v / 0.6647 = 18%. This means that 82% of the energy in the system was lost to supercapacitor self-discharge and leakage across the zener. This sets the upper bounds of power savings we can hope to achieve with clever code improvements.
Optimised code vs passive losses
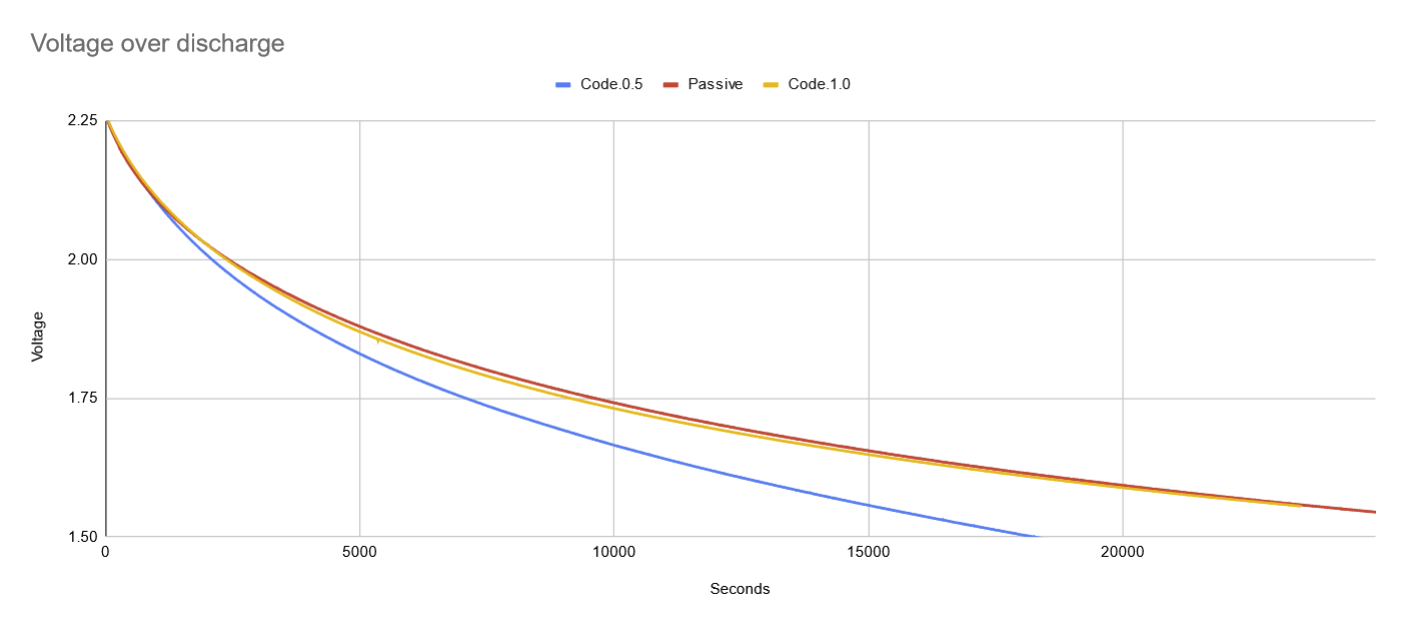
After optimising the code to disable unused peripherals and enter deep sleep between blinks, using the watchdog timer to wake to process the next frame, I was able to reduce power consumption to very close to the passive drain of the system. This represents roughly a 95% improvement in energy efficiency over the naive approach.
Isolating sources of lost energy
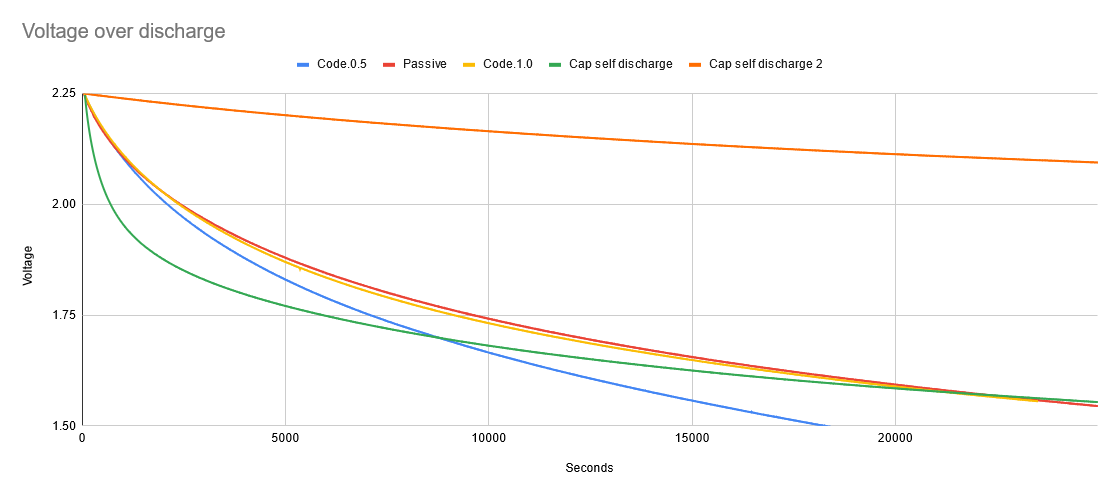
I wanted to confirm the source of my passive losses. I suspect the voltage limiting Zener diode. It's sized to handle sinking a reasonable amount of current (around 100mA) to ground to avoid overcharging the capacitors. The bigger the Zener, the more leakage. The datasheet of the one I'm using (MM1Z2V4, I think. JLC part C96629 isn't in their catalogue anymore and I didn't store the actual part number anywhere…) specifies a 120µA leakage current at 1V, which is in the right ballpark. I re-ran the passive discharge test but with a supercap charged directly from my benchtop supply and got a big surprise:
The isolated capacitor (green line) discharged even faster than the identical one in the circuit, leaking across the Zener! What?
I assumed there was a difference in my experimental setup. I ran the test again, but this time I charged the second capacitor by connecting it to the circuit alongside the other supercap. I let it charge up then removed it from the circuit and let it discharge in isolation.
The red line is the second isolated discharge test.
I think the difference between these tests can be explained by the capacitor not being fully charged in the first test. The voltage read the same at the start of the test, but rapidly tailed off. I suspect that voltage isn't a perfect measure of the stored energy in a supercap. To fully charge it must sit at a certain voltage until the current drops to zero. In the first test I removed the power as soon as the voltage hit the target, and my benchtop PSU only shows current down to 100mA. In the second test the energy properly “soaked in” and it held its voltage for much longer.
Conclusions
These tests gave me a good idea of what the runtime of the final device will be. They also confirmed that the power consumption of the microcontroller and LED is less than the leakage across the Zener, but more than the self-discharge of the supercaps. The result is that I can scale up the number of supercaps and be confident that the runtime will increase more or less linearly.
def calcEnergy(farads, deltaVolts):
    return (farads/2)*pow(deltaVolts, 2)
With 25 Farads capacity, and a deltaVolts of 0.75v (started at 2.25v, ended at 1.5v), we get a stored energy of 7 joules.
def calcWatts(joules, seconds):
    return joules/seconds
Over 30000 seconds we get 233µW. At an average of 1.875v that gives us 124µA. The rated leakage current of the Zener is 120µA at 1v, so this seems reasonable. Once the full compliment of six 40-Farad caps are installed we should get a runtime of around 6 days. These numbers are all very rough, and treat a pretty non-linear curve as linear, but they should be approximately close.
Video
Next Time
I don't think there's much point in trying to further improve energy efficiency of the code. The next steps might be adding features like multiple message sequences, and/or improving the space efficiency to fit more/longer messages. I may investigate alternative means of regulating the voltage from the solar cells. I need to find a replacement Zener, as JLC seems to have disappeared the one I used for the first batch of PCBs.

