projects:blinker:work_logs:6_power_consumption_testing
Differences
This shows you the differences between two versions of the page.
| Both sides previous revisionPrevious revisionNext revision | Previous revisionNext revisionBoth sides next revision | ||
| projects:blinker:work_logs:6_power_consumption_testing [2022/03/06 22:33] – tjhowse | projects:blinker:work_logs:6_power_consumption_testing [2022/03/07 04:38] – tjhowse | ||
|---|---|---|---|
| Line 56: | Line 56: | ||
| The isolated capacitor (green line) discharged even faster than the identical one in the circuit, leaking across the Zener! What? | The isolated capacitor (green line) discharged even faster than the identical one in the circuit, leaking across the Zener! What? | ||
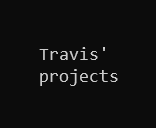
| - | I assumed there was a difference in my experimental setup. I ran the test again, but this time I charged the second capacitor by connecting it to the circuit | + | I assumed there was a difference in my experimental setup. I ran the test again, but this time I charged the second capacitor by connecting it to the circuit |
| + | {{: | ||
| + | |||
| + | The red line is the second isolated discharge test. | ||
| + | |||
| + | I think the difference between these tests can be explained by the capacitor not being fully charged in the first test. The voltage read the same at the start of the test, but rapidly tailed off. I suspect that voltage isn't a perfect measure of the stored energy in a supercap. To fully charge it must sit at a certain voltage until the current drops to zero. In the first test I removed the power as soon as the voltage hit the target, and my benchtop PSU only shows current down to 100mA. In the second test the energy properly " | ||
| + | |||
| + | ===== Conclusions ===== | ||
| + | |||
| + | These tests gave me a good idea of what the runtime of the final device will be. They also confirmed that the power consumption of the microcontroller and LED is less than the leakage across the Zener, but more than the self-discharge of the supercaps. The result is that I can scale up the number of supercaps and be confident that the runtime will increase more or less linearly. | ||
| + | |||
| + | {code} | ||
| + | def calcEnergy(farads, | ||
| + | return (farads/ | ||
| + | {/code} | ||
| + | |||
| + | With 25 Farads capacity, and a deltaVolts of 0.75v (started at 2.25v, ended at 1.5v), we get a stored energy of 7 joules. | ||
| + | |||
| + | {code} | ||
| + | def calcWatts(joules, | ||
| + | return joules/ | ||
| + | {/code} | ||
| + | |||
| + | Over 30000 seconds we get 233µW. At an average of 1.875V that gives us 124µA. The rated leakage current of the Zener is 120µA at 1v, so this seems reasonable. Once the full compliment of six 40-Farad caps are installed we should get a runtime of around 6 days. These numbers are all very rough, and treat a pretty non-linear curve as linear, but they should be approximately close. | ||
| ===== Video ===== | ===== Video ===== | ||
| Line 67: | Line 90: | ||
| ===== Next Time ===== | ===== Next Time ===== | ||
| - | I don't think there' | + | I don't think there' |
| [<6>] | [<6>] | ||
projects/blinker/work_logs/6_power_consumption_testing.txt · Last modified: 2022/03/07 04:47 by tjhowse